Thiết bị ethertap 513-00011A Procentec EtherTAP 10/100

0944911836 Ms. Duyên
0972835740 Ms. Hà
0385097045 Mr. Hiếu
0392468875 Ms. Anh
0707602728 Ms. Vân
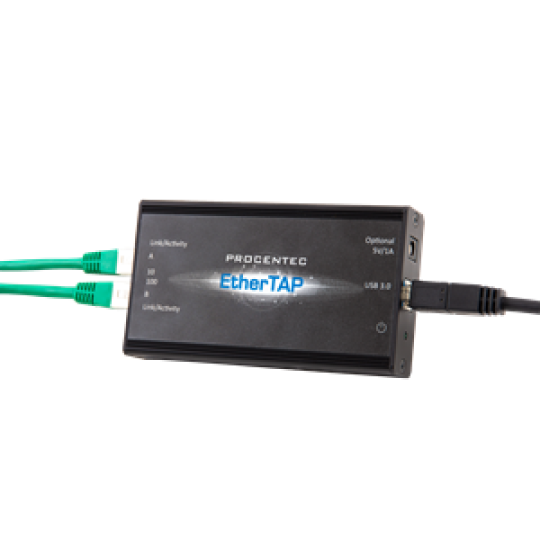
Thiết bị ethertap 513-00011A Procentec EtherTAP 10/100
EtherTAP: 10/100
10/100 USB Powered ethernet tap point, with the ability to do:
* Hardware aggregation, SPAN or In-Line Modes
* Frame Capture, deep packet inspection, and hardware filtering
* CRC Error Capture, Packet Slicing, Real Time Statistics, Direct
capture to a disk
Works with EtherTAP: PROFINET Analysis License (101-700204) ,
Wireshark, ClearSight, OptiView, NetSpector, OmniPeak,
NetDecoder, Packetyzer, Ethertest
Supplied with manual, drivers, 1 x 1m RJ/45, 1 x 1 USB
Nhà sản xuất: PROCENTEC
-
513-00011A Procentec
-
Liên hệ
-
1071
- Thông tin sản phẩm
- Bình luận
PROCENTEC is taking diagnostics to the next level. The new EtherTAP monitoring interface is the bridge to the Osiris functionality on our portable Mercury tablet and permanent Atlas module. Both devices run on diagnostics platform Osiris to analyse the information feed from the EtherTAP. This enables our build-in assistant Delphi to come up with a solution to help you to quickly and effectively get your operations running again.
Passive diagnostics
Cycle time per device
Positive and negative message jitter
Number of dropped packets
Alarm triggers
The EtherTAP – Message Analysis feature allows you to do deep analysis of PROFINET traffic by placing an EtherTAP between devices exchanging PROFINET traffic (usually between a Controller and the first switch).
To make tapping available make sure you have:
- A correct license
- An EtherTAP placed between two devices communicating over PROFINET
- A running measurement
Network overview and device details
When you click the tile on the Dashboard you can read out four types of data:
The cycle time per device
PROFINET devices send data on a very periodic basis, these are called cycle times. Cycle times are defined in milliseconds.
Positive and negative message jitter as a percentage of the cycle time
Jitter is the deviation of a message from the intended cycle time. Example: if a device sends a message every 4ms, then a delay of an additional 4ms leads to a jitter of 100%. In case the message is 1ms early then a jitter of 25% is being reported. Both messages which are early and late are reported in absolute percentages.
The number of Dropped Packets
Dropped packets are PROFINET messages which were missing in the communication cycle. Healthy PROFINET networks should never drop messages, too many consecutive dropped packets can cause the stop of the network.
The number of Alarms
PROFINET alarms are specific error messages sent by the controller or the devices using the PROFINET protocol.
Message Recording
Osiris records Ethernet packets when something is wrong in the network. Recording is done in the .pcapng format, which allows easy opening in Wireshark.
Three triggers can be used to record a message file:
- PROFINET Alarms
- Jitter too high
- Dropped PROFINET packets
Ethernet Analysis
Select ‘Ethernet’ as the protocol in the top-left drop-down bar to view the Ethernet statistics. These statistics are collected by the EtherTAP of the link it is currently monitoring. Here is possible to analyze the amount of Network load and communication errors happening on the Ethernet link with the timestamp of the last change.
The EtherTAP has a Port A and Port B, which are separately listed, each with their individual statistics.
Sản phẩm cùng loại


Thông tin liên hệ
CÔNG TY TNHH GIẢI PHÁP TỰ ĐỘNG HÓA SAS
Mã số thuế: 0315763284
Địa chỉ: 409/48 Nguyễn Oanh, Phường 17, Quận Gò Vấp, TP Hồ Chí Minh,Việt Nam.  Xem bản đồ
Tên giao dịch: SAS AUTOMATION SOLUTIONS COMPANY LIMITED
Tên viết tắt: SAS AUTOMATION CO., LTD
Tag seo
Copyright © 2020 your name Designed by:Nina Co.,Ltd
online: 193
Trong tháng: 10000
Tổng truy cập: 4066455
